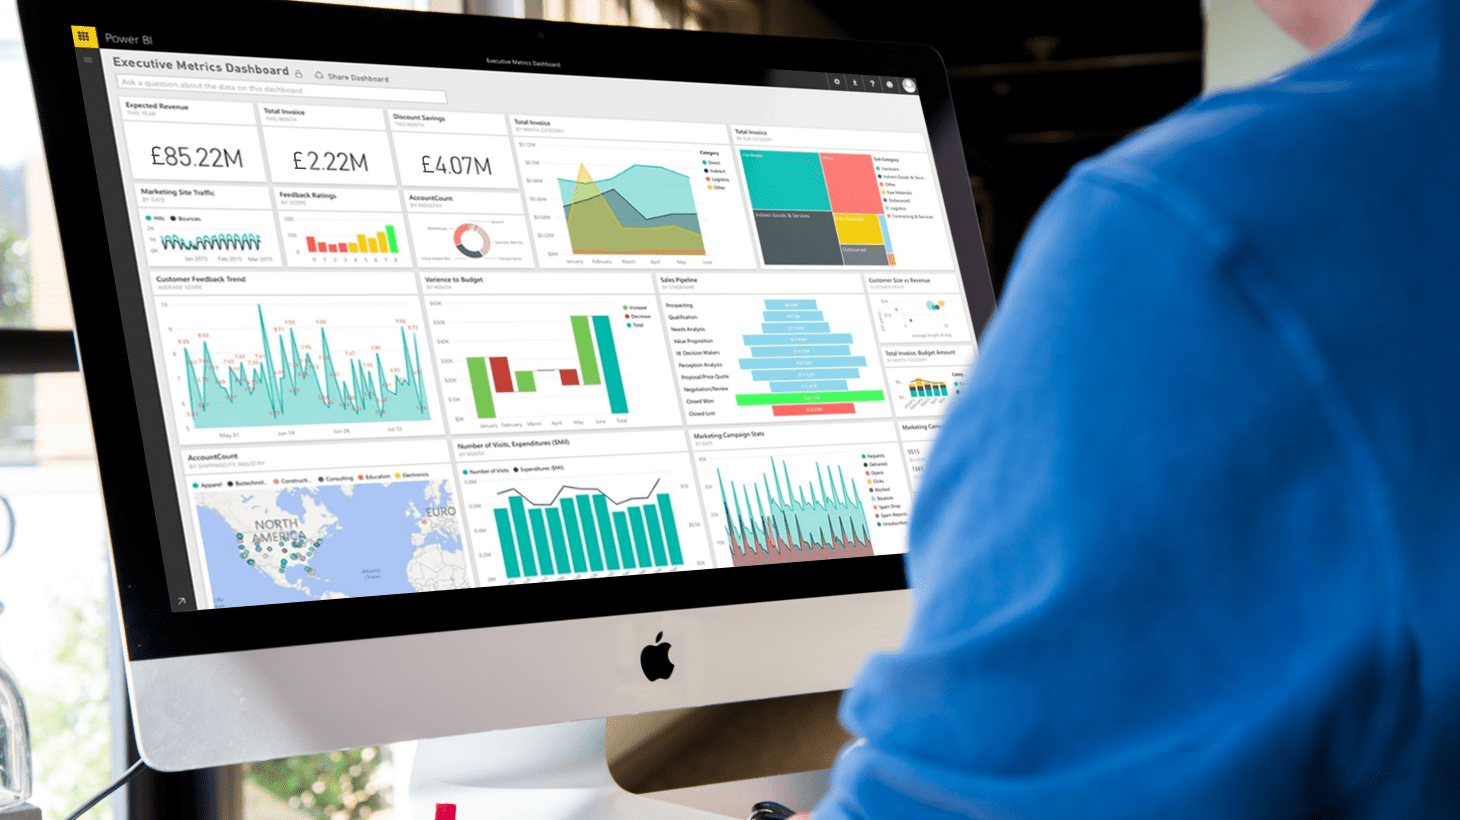
Microsoft Power BI Training
Learn how to turn your business data into an opportunity
Power BI courses
Whether you’re new to the program and need help setting it up or want to know more about what it can do, we tailor our Microsoft Power BI training to suit your needs. We’ll train you using your business data so that you fully benefit from learning how to create dashboards that will drive your team’s productivity.
Our Microsoft Power BI course is entirely flexible. We’ll teach you what you need to know so your business can enhance its reporting functionalities and visibility through guided learning. As a data analyst, you'll learn how to transform data sets into powerful visuals and reports, utilizing data visualization techniques that bring insights to life.
Location: Frome, BA11 2RY or your office.
Timings: Half-day or full-day course.
Price: Dependent on your requirements.
For more information, get in touch today.
Area's we can cover
-
Overview of Power BI and its capabilities
-
The Toolset available to you
-
Introduction to apps available in Power BI Online by different SaaS applications
-
Accessing Data from Excel as a data source
-
Using the Quick Measures features
-
Introduction to DAX language for advanced analytics and data modelling
-
How to create reports and dashboards
-
How to create use backgrounds, themes and templates when creating dashboards
-
How to use the Q&A feature on our dashboards
-
Learn best practices for using the program
-
Utilizing Power Query for data transformation and preparation
-
How to publish reports
Unlock your Data with Power BI
Power BI (business intelligence) allows millions of users worldwide to better understand their business by using a format and language most people are comfortable with. If you've used products from the Microsoft Office suite before, then you'll find the switch far more straightforward than traditional reporting software.
Whether you keep your data in Excel spreadsheets or a collection of data warehouses, you'll be able to easily connect to your data sources. You'll be able to visualise your data, discover what's important, and share your reports with anyone.
Through interactive exercises, you'll learn how to use this familiar Microsoft app to quickly drill into your data and create rich, interactive reports. From creating your first graph to trying the latest advanced techniques, our courses make it easy to learn about Power BI.

Benefits of Power BI
-
Data Analytics - Power BI can collect your company data, whether it's cloud-based or located locally, and provides quick and easy access to this data. Get a live 360 ° view of your business, enabling you to search and explore your data quickly and easily.
-
Interactive reporting - Even when you're on the go you can see all your data on one screen with the Power BI Mobile app, which automatically updates changes in data.
-
Financial overview - See all your financial data in a single view.
-
User-friendly mobility - With the intuitive tools you can explore the underlying data, which makes it easy to find exactly the answers you need.
-
Data Visualisation - With Power BI you can be both creative and productive. Combine data from various databases, files and web services with the visual tools in Power BI and gain unique insight into your data.


Excel vs Power BI, which is best for reporting?
In today's business world, having tools that allow us to quickly and intuitively analyse data and transform databases into understandable information is crucial to success. More and more companies realise the importance of data analysis and its relationship to improving performance and increasing profits. That is why choosing the right tools is so important. Excel and Power BI are two of the most popular data analysis applications globally, but which one is better?
Watch our webinar to find out what we think!

"The support department within Netitude has always serviced our business needs well. In times of crisis they react quickly, ensuring minimum fuss and downtime. We have formed a good relationship with Netitude and they now feel like an ‘internal department."
James Wolff
Serious Stages Ltd
Work with an award-winning national MSP
Our in-house UK based service desk works to ISO and ITIL aligned best practices, with industry-leading tools and technology to deliver the best service in the market.
We are ranked among the top Managed IT service providers worldwide. Our verified client references and outstanding client retention rate underline our commitment to exceptional service.

Get in touch, let's talk about better reporting
If you'd like to find out more about our Power BI courses, book a call and start your journey with us today.


